


Consolidated Carbon
Welcome to Consolidated Carbon, a data consolidation, analysis, and automation project.
Summary: For a large watch & jewelry company, I developed a new process to consolidate, analyze, and categorize diverse datasets (e.g. finance, energy, procurement) for annual sustainability reporting. My goal was to introduce a one-click process to merge structure, and prepare all carbon-producing impact datasets for emission calculations, visualization and reporting. An automated process significantly cut routine processing time and allowed a better formatted database of emissions and emission factors.
Scroll down for see a detailed description of the steps I took.
Original Process: To develop an annual carbon footprint , Individual spreadsheets were gathered from various business units throughout the global value chain. Each provided a uniquely formatted file, without GHG protocol categorization, emission factors, or conversions. Just raw data.
Data was manually input from each source (60+) into a single Excel file, where appropriate categorization (e.g. Scope 1-3, fuel, services, raw material etc.) was added - with CO2e calculated after.

Breaking Down the Problem
-
Data from different teams comes in different formats, preventing an ease of merging
-
Manual copy and paste is used to consolidate data, which is error prone
-
Application of emission factors for calculations must be filled in category-by-category
-
Category specific calculations must be re-done yearly using Excel formulas – a demanding, time consuming process
Step 1: Feasibility Test
To determine the potential utility of introducing a new process I:
-
Engaged with teams globally to consider pre-existing tools, lessons learned over the years, data sources and structures
-
Developed a potential plan of action
-
Sampled a dataset to determine if a proposed data consolidation tool (Alteryx) would be effective at data consolidation for a new sustainability database
Tool Description
Alteryx's data analysis and consolidation functions are similar to that of PowerBI and Tableau. The user selects transformation steps to add to the canvas, which allow manipulations and calculated fields to be developed using various data types (string, datetime, integer, etc). The process can be run in the cloud; the tool is useful for preparing data for dashboard use.
Step 2: Consolidation
&
Categorization
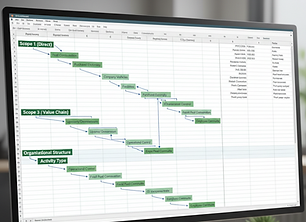


The program of choice for consolidation - Alteryx, allows users to link different datasets, perform merges, joins, create formulaic columns, and calculations. Once the automation rules are established, users can run an automated steps assigned for each dataset - like a macro, but extending beyond a single workbook. In my case, the final output would be a one-click fully generated multi-year database of all carbon emissions across the value chain.
To consolidate the data across the value chain I:
-
Gathered all raw datasets
-
Reviewed data quality and accuracy
-
Established data-cleaning and calculated columns automation steps for CO2e conversion with up-to-date emission factors
-
Assigned complex, multi-layer GHG Protocol categorization (15+ levels of categorization rows)
-
Assigned rules for merging, joining, and calculating outputs
-
Documentation of steps taken

The Result
A one-click, automated process allowing the mering, consolidation and calculation of the carbon footprint from all business units globally from 2019-2023, exported into a single CSV/Excel sheet - saving approx. 40 hours per month of manual processing time.